Delivery Dashboard
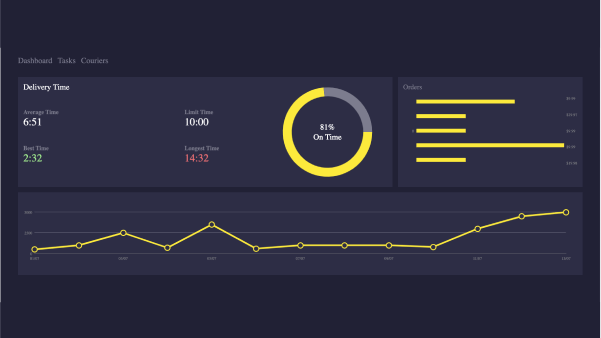
Delivery Time
Average Time
6:51
Limit Time
10:00
Best Time
2:32
Longest Time
14:32
<!doctype html>
<html>

<head>
  <meta charset="utf-8">
  <title>ZingSoft Demo</title>
  <script nonce="undefined" src="https://cdn.zingchart.com/zingchart.min.js"></script>
  <style>
    /* Defaults */
    :root {
      --purple: #212135;
      --lightPurple: #2D2D45;
      --yellow: #FCEA3C;
      --white: #FFFFFF;
      --lightGray: #7C7C8E;
      --green: #A5F291;
      --red: #FA7477;
    }

    .zc-body {
      justify-content: center;
      background-color: var(--purple);
      font-family: Poppins;
    }

    /* Main Wrapper */
    .dashboard {
      margin: 0 auto;
      padding-bottom: 1.5rem;
      width: 100%;
      max-width: 95%;
    }

    /* Nav */
    .dashboard-nav {
      display: flex;
      align-items: center;
      min-height: 100px;
    }

    .dashboard-nav a {
      color: var(--lightGray);
      font-size: 24px;
      text-decoration: none;
      transition: .3s ease-in-out;
    }

    .dashboard-nav a:hover {
      color: var(--white);
    }

    .dashboard-nav a+a {
      margin-left: 1rem;
    }

    /* Body */
    .dashboard-body {
      min-height: 575px;
      display: grid;
      grid-template-columns: repeat(3, 1fr);
      grid-column-gap: 1rem;
      grid-row-gap: 1rem;
    }

    /* Panel */
    .dashboard-panel {
      min-height: 250px;
      padding: 1rem;
      grid-column: 1 / -1;
      color: var(--lightGray);
      font-size: 1.125rem;
      background-color: var(--lightPurple);
    }

    .dashboard-panel.nopad {
      padding: 0;
    }

    .dashboard-panel.layout-2of3 {
      grid-column: 1 / -2;
    }

    .dashboard-panel.layout-1of3 {
      grid-column: 3 / -2;
    }

    /* Panel Title */
    .dashboard-intro {
      font-size: 24px;
      color: var(--white);
      font-weight: normal;
    }

    /* Times */
    .panel-times {
      min-height: 300px;
      display: grid;
      grid-template-columns: 2fr 1fr;
      grid-column-gap: 1rem;
      grid-row-gap: 1rem;
    }

    .dashboard-times {
      display: grid;
      grid-template-columns: 2fr 1fr;
      grid-column-gap: 1rem;
      grid-row-gap: 1rem;
    }

    .dashboard-times div strong {
      display: block;
    }

    .dashboard-times div span {
      color: var(--white);
      font-size: 2rem;
    }

    .dashboard-times div .green {
      color: var(--green);
    }

    .dashboard-times div .red {
      color: var(--red);
    }

    .dashboard-times .dashboard-intro {
      grid-column: 1 / -1;
    }

    .zc-ref {
      display: none;
    }
  </style>
</head>

<body class="zc-body">

  <div class="dashboard">

    <!-- Nav -->
    <nav class="dashboard-nav">
      <a href="#">Dashboard</a>
      <a href="#">Tasks</a>
      <a href="#">Couriers</a>
    </nav>

    <!-- Dashboard -->
    <div class="dashboard-body">

      <!-- Panel -->
      <div class="dashboard-panel layout-2of3 panel-times">

        <!-- Delivery Times -->
        <div class="dashboard-times">
          <strong class="dashboard-intro">Delivery Time</strong>

          <div>
            <strong>Average Time</strong>
            <span>6:51</span>
          </div>

          <div>
            <strong>Limit Time</strong>
            <span>10:00</span>
          </div>

          <div>
            <strong>Best Time</strong>
            <span class="green">2:32</span></p>
          </div>

          <div>
            <strong>Longest Time</strong>
            <span class="red">14:32</span></p>
          </div>

        </div>

        <!-- Chart 1 -->
        <div id="chart1">
          <a href="https://www.zingchart.com/" rel="noopener" class="zc-ref">Powered by ZingChart</a>
        </div>

      </div>


      <!-- Panel -->
      <div class="dashboard-panel layout-1of3 nopad">
        <div id="chart2">
          <a href="https://www.zingchart.com/" rel="noopener" class="zc-ref">Powered by ZingChart</a>
        </div>
      </div>


      <!-- Panel -->
      <div class="dashboard-panel nopad">
        <div id="chart3">
          <a href="https://www.zingchart.com/" rel="noopener" class="zc-ref">Powered by ZingChart</a>
        </div>
      </div>

    </div>

  </div>

  <script>
    ZC.LICENSE = ["569d52cefae586f634c54f86dc99e6a9", "b55b025e438fa8a98e32482b5f768ff5"]; // DEFINE CHART LOCATIONS (IDS)
    // -----------------------------
    // Main chart render location
    let chart1Id = 'chart1';
    let chart2Id = 'chart2';
    let chart3Id = 'chart3';

    // CHART DATA
    // -----------------------------
    let sales = [
      [19.98],
      [9.99],
      [9.99],
      [29.97],
      [9.99]
    ];
    let income = [
      500, 1000, 2500, 700, 3500, 600, 1000, 1000, 1000, 800, 3000, 4500, 5000,
    ];
    let dates = [
      '01/07',
      '02/07',
      '03/07',
      '04/07',
      '05/07',
      '06/07',
      '07/07',
      '08/07',
      '09/07',
      '10/07',
      '11/07',
      '12/07',
      '13/07',
    ];

    // CHART CONFIG
    // -----------------------------

    // Chart 1
    let chart1Data = {
      type: 'ring',
      globals: {
        fontFamily: 'Poppins',
      },
      backgroundColor: 'transparent',
      plot: {
        valueBox: {
          text: '81%<br>On Time',
          fontSize: '24px',
          fontStyle: 'normal',
          fontWeight: 'normal',
          placement: 'center',
        },
        slice: '80%',
      },
      plotarea: {
        margin: '0px 0px 0px 0px',
      },
      series: [{
          values: [81],
          backgroundColor: 'var(--yellow)',
          borderWidth: '0px',
          shadow: false,
        },
        {
          values: [29],
          backgroundColor: 'var(--lightGray)',
          borderWidth: '0px',
          shadow: false,
        },
      ],
    };

    // Chart 2
    let chart2Data = {
      type: 'hbar',
      globals: {
        fontFamily: 'Poppins',
      },
      backgroundColor: 'transparent',
      title: {
        text: 'Orders',
        align: 'left',
        fontColor: 'var(--lightGray)',
        fontWeight: 'normal',
        padding: '16px',
      },
      plot: {
        tooltip: {
          visible: false,
        },
        barSpace: '32px',
        barWidth: '12px',
        borderWidth: '0px',
      },
      plotarea: {
        margin: '40px 56px 16px 56px',
      },
      scaleY: {
        visible: false,
      },
      scaleX: {
        labels: [],
        lineWidth: '0px',
        tick: {
          visible: false,
        },
      },
      scaleX2: {
        values: [
          '$' + sales[0],
          '$' + sales[1],
          '$' + sales[2],
          '$' + sales[3],
          '$' + sales[4],
        ],
        lineWidth: '0px',
        tick: {
          visible: false,
        },
      },
      series: [{
          values: sales[0],
          backgroundColor: 'var(--yellow)',
        },
        {
          values: sales[1],
          backgroundColor: 'var(--yellow)',
        },
        {
          values: sales[2],
          backgroundColor: 'var(--yellow)',
        },
        {
          values: sales[3],
          backgroundColor: 'var(--yellow)',
        },
        {
          values: sales[4],
          backgroundColor: 'var(--yellow)',
        },
      ],
    };

    // Chart 3
    let chart3Data = {
      type: 'line',
      globals: {
        fontFamily: 'Poppins',
      },
      backgroundColor: 'transparent',
      scaleX: {
        labels: dates,
        tick: {
          visible: false,
        },
      },
      scaleY: {
        values: '0: 5000: 2500',
        guide: {
          lineStyle: 'solid',
          lineColor: 'var(--lightGray)',
        },
        lineWidth: '0px',
        tick: {
          visible: false,
        },
      },
      series: [{
        values: income,
        lineColor: 'var(--yellow)',
        lineWidth: '5px',
        marker: {
          backgroundColor: 'var(--lightPurple)',
          borderColor: 'var(--yellow)',
          borderWidth: '3px',
          size: 8,
        },
      }, ],
    };

    // RENDER CHARTS
    // -----------------------------

    // Chart 1
    zingchart.render({
      id: chart1Id,
      data: chart1Data,
      height: '300px',
      width: '100%',
    });

    // Chart 2
    zingchart.render({
      id: chart2Id,
      data: chart2Data,
      height: '300px',
      width: '100%',
    });

    // Chart 3
    zingchart.render({
      id: chart3Id,
      data: chart3Data,
      height: '250px',
      width: '100%',
    });
  </script>
</body>

</html>
<!doctype html>
<html>
<head>
  <meta charset="utf-8">
  <title>ZingSoft Demo</title>
  <script src="https://cdn.zingchart.com/zingchart.min.js"></script>
</head>

<body class="zc-body">

  <div class="dashboard">

    <!-- Nav -->
    <nav class="dashboard-nav">
      <a href="#">Dashboard</a>
      <a href="#">Tasks</a>
      <a href="#">Couriers</a>
    </nav>

    <!-- Dashboard -->
    <div class="dashboard-body">

      <!-- Panel -->
      <div class="dashboard-panel layout-2of3 panel-times">

        <!-- Delivery Times -->
        <div class="dashboard-times">
          <strong class="dashboard-intro">Delivery Time</strong>

          <div>
            <strong>Average Time</strong>
            <span>6:51</span>
          </div>

          <div>
            <strong>Limit Time</strong>
            <span>10:00</span>
          </div>

          <div>
            <strong>Best Time</strong>
            <span class="green">2:32</span></p>
          </div>

          <div>
            <strong>Longest Time</strong>
            <span class="red">14:32</span></p>
          </div>

        </div>

        <!-- Chart 1 -->
        <div id="chart1">
          <a href="https://www.zingchart.com/" rel="noopener" class="zc-ref">Powered by ZingChart</a>
        </div>

      </div>


      <!-- Panel -->
      <div class="dashboard-panel layout-1of3 nopad">
        <div id="chart2">
          <a href="https://www.zingchart.com/" rel="noopener" class="zc-ref">Powered by ZingChart</a>
        </div>
      </div>


      <!-- Panel -->
      <div class="dashboard-panel nopad">
        <div id="chart3">
          <a href="https://www.zingchart.com/" rel="noopener" class="zc-ref">Powered by ZingChart</a>
        </div>
      </div>

    </div>

  </div>

</body>
</html>
// DEFINE CHART LOCATIONS (IDS)
// -----------------------------
// Main chart render location
let chart1Id = 'chart1';
let chart2Id = 'chart2';
let chart3Id = 'chart3';

// CHART DATA
// -----------------------------
let sales = [[19.98], [9.99], [9.99], [29.97], [9.99]];
let income = [
  500, 1000, 2500, 700, 3500, 600, 1000, 1000, 1000, 800, 3000, 4500, 5000,
];
let dates = [
  '01/07',
  '02/07',
  '03/07',
  '04/07',
  '05/07',
  '06/07',
  '07/07',
  '08/07',
  '09/07',
  '10/07',
  '11/07',
  '12/07',
  '13/07',
];

// CHART CONFIG
// -----------------------------

// Chart 1
let chart1Data = {
  type: 'ring',
  globals: {
    fontFamily: 'Poppins',
  },
  backgroundColor: 'transparent',
  plot: {
    valueBox: {
      text: '81%<br>On Time',
      fontSize: '24px',
      fontStyle: 'normal',
      fontWeight: 'normal',
      placement: 'center',
    },
    slice: '80%',
  },
  plotarea: {
    margin: '0px 0px 0px 0px',
  },
  series: [
    {
      values: [81],
      backgroundColor: 'var(--yellow)',
      borderWidth: '0px',
      shadow: false,
    },
    {
      values: [29],
      backgroundColor: 'var(--lightGray)',
      borderWidth: '0px',
      shadow: false,
    },
  ],
};

// Chart 2
let chart2Data = {
  type: 'hbar',
  globals: {
    fontFamily: 'Poppins',
  },
  backgroundColor: 'transparent',
  title: {
    text: 'Orders',
    align: 'left',
    fontColor: 'var(--lightGray)',
    fontWeight: 'normal',
    padding: '16px',
  },
  plot: {
    tooltip: {
      visible: false,
    },
    barSpace: '32px',
    barWidth: '12px',
    borderWidth: '0px',
  },
  plotarea: {
    margin: '40px 56px 16px 56px',
  },
  scaleY: {
    visible: false,
  },
  scaleX: {
    labels: [],
    lineWidth: '0px',
    tick: {
      visible: false,
    },
  },
  scaleX2: {
    values: [
      '$' + sales[0],
      '$' + sales[1],
      '$' + sales[2],
      '$' + sales[3],
      '$' + sales[4],
    ],
    lineWidth: '0px',
    tick: {
      visible: false,
    },
  },
  series: [
    {
      values: sales[0],
      backgroundColor: 'var(--yellow)',
    },
    {
      values: sales[1],
      backgroundColor: 'var(--yellow)',
    },
    {
      values: sales[2],
      backgroundColor: 'var(--yellow)',
    },
    {
      values: sales[3],
      backgroundColor: 'var(--yellow)',
    },
    {
      values: sales[4],
      backgroundColor: 'var(--yellow)',
    },
  ],
};

// Chart 3
let chart3Data = {
  type: 'line',
  globals: {
    fontFamily: 'Poppins',
  },
  backgroundColor: 'transparent',
  scaleX: {
    labels: dates,
    tick: {
      visible: false,
    },
  },
  scaleY: {
    values: '0: 5000: 2500',
    guide: {
      lineStyle: 'solid',
      lineColor: 'var(--lightGray)',
    },
    lineWidth: '0px',
    tick: {
      visible: false,
    },
  },
  series: [
    {
      values: income,
      lineColor: 'var(--yellow)',
      lineWidth: '5px',
      marker: {
        backgroundColor: 'var(--lightPurple)',
        borderColor: 'var(--yellow)',
        borderWidth: '3px',
        size: 8,
      },
    },
  ],
};

// RENDER CHARTS
// -----------------------------

// Chart 1
zingchart.render({
  id: chart1Id,
  data: chart1Data,
  height: '300px',
  width: '100%',
});

// Chart 2
zingchart.render({
  id: chart2Id,
  data: chart2Data,
  height: '300px',
  width: '100%',
});

// Chart 3
zingchart.render({
  id: chart3Id,
  data: chart3Data,
  height: '250px',
  width: '100%',
});
/* Defaults */
:root {
  --purple: #212135;
  --lightPurple: #2D2D45;
  --yellow: #FCEA3C;
  --white: #FFFFFF;
  --lightGray: #7C7C8E;
  --green: #A5F291;
  --red: #FA7477;
}

.zc-body {
  justify-content: center;
  background-color: var(--purple);
  font-family: Poppins;
}

/* Main Wrapper */
.dashboard {
  margin: 0 auto;
  padding-bottom: 1.5rem;
  width: 100%;
  max-width: 95%;
}

/* Nav */
.dashboard-nav {
  display: flex;
  align-items: center;
  min-height: 100px;
}
.dashboard-nav a {
  color: var(--lightGray);
  font-size: 24px;
  text-decoration: none;
  transition: .3s ease-in-out;
}
.dashboard-nav a:hover {
  color: var(--white);
}
.dashboard-nav a + a {
  margin-left: 1rem;
}

/* Body */
.dashboard-body {
  min-height: 575px;
  display: grid;
  grid-template-columns: repeat(3, 1fr);
  grid-column-gap: 1rem;
  grid-row-gap: 1rem;
}

/* Panel */
.dashboard-panel {
  min-height: 250px;
  padding: 1rem;
  grid-column: 1 / -1;
  color: var(--lightGray);
  font-size: 1.125rem;
  background-color: var(--lightPurple);
}
.dashboard-panel.nopad { padding:0; }
.dashboard-panel.layout-2of3 { grid-column: 1 / -2; }
.dashboard-panel.layout-1of3 { grid-column: 3 / -2; }

/* Panel Title */
.dashboard-intro {
  font-size: 24px;
  color: var(--white);
  font-weight: normal;
}

/* Times */
.panel-times {
  min-height:300px;
  display:grid;
  grid-template-columns: 2fr 1fr;
  grid-column-gap: 1rem;
  grid-row-gap: 1rem;
}

.dashboard-times {
  display:grid;
  grid-template-columns: 2fr 1fr;
  grid-column-gap: 1rem;
  grid-row-gap: 1rem;
}
.dashboard-times div strong { display:block; }
.dashboard-times div span { color:var(--white); font-size:2rem; }
.dashboard-times div .green { color:var(--green); }
.dashboard-times div .red { color:var(--red); }

.dashboard-times .dashboard-intro {
  grid-column: 1 / -1;
}

.zc-ref { display:none; }