<!doctype html>
<html>
<head>
<meta charset="utf-8">
<title>ZingSoft Demo</title>
<script nonce="undefined" src="https://cdn.zingchart.com/zingchart.min.js"></script>
<style>
.zc-body {
background-color: #fff;
}
.zc-grid {
margin: 0 auto;
padding: 1rem;
width: 100%;
max-width: 1400px;
box-sizing: border-box;
background: #fff;
}
.zc-chart {
min-height: 500px;
}
.zc-ref {
display: none;
}
/* TABLET: PORTRAIT+ */
@media screen and (min-width:768px) {
.zc-grid {
display: grid;
grid-template-columns: 500px 1fr;
grid-column-gap: 2rem;
}
}
</style>
</head>
<body class="zc-body">
<script nonce="undefined" src='https://s3-us-west-2.amazonaws.com/s.cdpn.io/374756/airports.js'></script>
<div class="zc-grid">
<div id="zcmap" class="zc-chart">
<a href="https://www.zingchart.com/" rel="noopener" class="zc-ref">Powered by ZingChart</a>
</div>
<div id="zcline" class="zc-chart"></div>
</div>
<script>
ZC.LICENSE = ["569d52cefae586f634c54f86dc99e6a9", "b55b025e438fa8a98e32482b5f768ff5"]; // INIT
// -----------------------------
// Define Module Location
zingchart.MODULESDIR = "https://cdn.zingchart.com/modules/";
// Load Maps
zingchart.loadModules('maps, maps-fraL2', render);
// DEFINE CHART LOCATIONS (IDS)
// -----------------------------
// Main chart render location(s)
let line = 'zcline';
let map = 'zcmap';
// letS
// -----------------------------
let iMaxAltitude = 0,
aValues = [],
aDataInfo = [],
aDataSize = [],
i;
// MAP CHART CONFIG
// -----------------------------
let gmap = {
type: 'null',
height: '100%',
width: '100%',
x: '10px',
y: 0,
legend: {
borderWidth: 0,
header: {
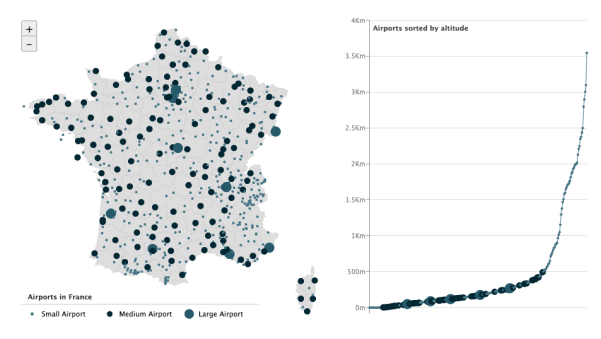
text: 'Airports in France',
align: 'left',
fontSize: '11px'
},
layout: '1x',
margin: 'auto auto 10px 10px',
toggleAction: 'none'
},
tooltip: {
align: 'left',
borderRadius: '3px',
callout: true,
calloutWidth: '16px',
calloutHeight: '8px',
fontSize: '13px',
fontWeight: 'bold',
padding: '10px 20px',
shadow: true,
shadowAlpha: 0.7,
shadowColor: '#333',
shadowDistance: 2
},
shapes: [{
type: 'zingchart.maps',
options: {
name: 'fraL2',
scale: true,
style: {
borderAlpha: 0.1,
borderColor: '#666',
hoverState: {
backgroundColor: 'none',
shadow: true,
shadowAlpha: 0.1,
shadowColor: '#369',
shadowDistance: 0
},
label: {
visible: false
}
}
}
}],
series: [{
text: 'Small Airport',
legendMarker: {
type: 'circle',
backgroundColor: '#467686',
size: '3px'
},
},
{
text: 'Medium Airport',
legendMarker: {
type: 'circle',
backgroundColor: '#022733',
size: '5px'
},
},
{
text: 'Large Airport',
legendMarker: {
type: 'circle',
backgroundColor: '#26596A',
size: '8px'
},
}
]
};
// CHART DATA
// -----------------------------
// Setup Airports
for (let i = 0; i < AIRPORTS.length; i++) {
// Some alt missing or negative
if (typeof(AIRPORTS[i][6]) === 'undefined') {
AIRPORTS[i][6] = 0;
}
AIRPORTS[i][6] = Math.max(0, AIRPORTS[i][6]);
}
// Sort
AIRPORTS.sort(function(a, b) {
return parseInt(a[6], 10) - parseInt(b[6], 10);
});
// Add data
for (let i = 0; i < AIRPORTS.length; i++) {
iMaxAltitude = Math.max(iMaxAltitude, Math.round(AIRPORTS[i][6] * 0.3048));
let size = 2,
color = '#467686';
if (AIRPORTS[i][2] === 'medium_airport') {
size = 5;
color = '#022733';
}
if (AIRPORTS[i][2] === 'large_airport') {
size = 8;
color = '#26596A';
}
aValues.push(Math.max(0, Math.round(AIRPORTS[i][6] * 0.3048)));
aDataInfo.push('<span style="font-size:15px">' + AIRPORTS[i][1] + '</span><br>' + AIRPORTS[i][3]);
aDataSize.push(size);
gmap.shapes.push({
id: 'airport' + i,
type: 'circle',
size: size,
backgroundColor: color,
y: AIRPORTS[i][4] + 'lat',
x: AIRPORTS[i][5] + 'lon',
map: 'fraL2',
hoverState: {
backgroundColor: 'none',
borderColor: color,
borderWidth: 2,
size: size + 4,
},
tooltip: {
text: '<span style="font-size:15px">' + AIRPORTS[i][1] + '</span><br>' + AIRPORTS[i][3]
}
});
}
// LINE CHART CONFIG
// -----------------------------
let gline = {
type: 'line',
height: '100%',
width: '100%',
x: 0,
y: 0,
title: {
text: 'Airports sorted by altitude',
align: 'left',
fontSize: 11,
padding: '15 10 10 45',
},
plotarea: {
margin: '10 20 25 40'
},
tooltip: {
visible: false
},
scaleX: {
zooming: true,
visible: false,
},
scaleY: {
format: '%vm',
item: {
fontSize: 10
},
minValue: 0,
maxValue: iMaxAltitude,
offsetStart: 10,
short: true,
},
crosshairX: {
plotLabel: {
text: '%data-info<br>%node-value m',
align: 'left',
borderRadius: 3,
borderWidth: 1,
fontSize: 13,
fontWeight: 'bold',
padding: '10 20',
shadow: true,
shadowAlpha: 0.7,
shadowColor: '#333',
shadowDistance: 2,
}
},
scrollX: {},
series: [{
values: aValues,
lineColor: '#467686',
lineWidth: 1,
maxNodes: 99999,
dataInfo: aDataInfo,
dataSize: aDataSize,
marker: {
type: 'circle',
backgroundColor: '#467686',
borderWidth: 0,
size: 2,
rules: [{
rule: '%data-size === 5',
size: 5,
backgroundColor: '#022733'
},
{
rule: '%data-size === 8',
size: 8,
backgroundColor: '#26596A'
}
]
}
}]
};
// ADD CHART INTERACTION
// -----------------------------
// Mouseout
zingchart.bind(line, 'guide_mouseout', function(p) {
zingchart.exec(map, 'removeobject', {
type: 'shape',
dynamic: true,
id: 'marker'
});
});
// Mousemove
zingchart.bind(line, 'guide_mousemove', function(p) {
let idx = p.items[0].nodeindex;
let size = 2;
if (AIRPORTS[idx][2] === 'medium_airport') {
size = 5;
}
if (AIRPORTS[idx][2] === 'large_airport') {
size = 8;
}
zingchart.exec(map, 'addobject', {
type: 'shape',
dynamic: true,
data: {
flat: true,
id: 'marker',
type: 'circle',
backgroundColor: 'none',
borderColor: '#900',
borderWidth: 2,
size: size + 4,
y: AIRPORTS[idx][4] + 'lat',
x: AIRPORTS[idx][5] + 'lon',
map: 'fraL2'
}
});
});
// RENDER CHARTS
// -----------------------------
zingchart.DEV.RESOURCES = false;
// Render charts after the maps module has loaded
// See `zingchart.loadModules()` above
function render() {
zingchart.render({
id: map,
width: '100%',
height: '100%',
output: 'svg',
data: gmap
});
zingchart.render({
id: line,
width: '100%',
height: '100%',
output: 'svg',
data: gline
});
}
</script>
</body>
</html>
// INIT
// -----------------------------
// Define Module Location
zingchart.MODULESDIR = "https://cdn.zingchart.com/modules/";
// Load Maps
zingchart.loadModules('maps, maps-fraL2', render);


// DEFINE CHART LOCATIONS (IDS)
// -----------------------------
// Main chart render location(s)
let line = 'zcline';
let map = 'zcmap';


// letS
// -----------------------------
let iMaxAltitude = 0, aValues = [], aDataInfo = [], aDataSize = [], i;


// MAP CHART CONFIG
// -----------------------------
let gmap = {
  type: 'null',
  height: '100%',
  width: '100%',
  x: '10px',
  y: 0,
  legend: {
    borderWidth: 0,
    header: {
      text: 'Airports in France',
      align: 'left',
      fontSize: '11px'
    },
    layout: '1x',
    margin: 'auto auto 10px 10px',
    toggleAction: 'none'
  },
  tooltip: {
    align: 'left',
    borderRadius: '3px',
    callout: true,
    calloutWidth: '16px',
    calloutHeight: '8px',
    fontSize: '13px',
    fontWeight: 'bold',
    padding: '10px 20px',
    shadow: true,
    shadowAlpha: 0.7,
    shadowColor: '#333',
    shadowDistance: 2
  },
  shapes: [
    {
      type: 'zingchart.maps',
      options: {
        name: 'fraL2',
        scale: true,
        style: {
          borderAlpha: 0.1,
          borderColor: '#666',
          hoverState: {
            backgroundColor: 'none',
            shadow: true,
            shadowAlpha: 0.1,
            shadowColor: '#369',
            shadowDistance: 0
          },
          label: {
            visible: false
          }
        }
      }
    }
  ],
  series: [
    {
      text: 'Small Airport',
      legendMarker: {
        type: 'circle',
        backgroundColor: '#467686',
        size: '3px'
      },
    },
    {
      text: 'Medium Airport',
      legendMarker: {
        type: 'circle',
        backgroundColor: '#022733',
        size: '5px'
      },
    },
    {
      text: 'Large Airport',
      legendMarker: {
        type: 'circle',
        backgroundColor: '#26596A',
        size: '8px'
      },
    }

  ]
};


// CHART DATA
// -----------------------------
// Setup Airports
for (let i = 0; i < AIRPORTS.length; i++) {
  // Some alt missing or negative
  if (typeof (AIRPORTS[i][6]) === 'undefined') {
    AIRPORTS[i][6] = 0;
  }
  AIRPORTS[i][6] = Math.max(0, AIRPORTS[i][6]);
}
// Sort
AIRPORTS.sort(function (a, b) {
  return parseInt(a[6], 10) - parseInt(b[6], 10);
});
// Add data
for (let i = 0; i < AIRPORTS.length; i++) {
  iMaxAltitude = Math.max(iMaxAltitude, Math.round(AIRPORTS[i][6] * 0.3048));
  let size = 2, color = '#467686';
  if (AIRPORTS[i][2] === 'medium_airport') {
    size = 5;
    color = '#022733';
  }
  if (AIRPORTS[i][2] === 'large_airport') {
    size = 8;
    color = '#26596A';
  }

  aValues.push(Math.max(0, Math.round(AIRPORTS[i][6] * 0.3048)));
  aDataInfo.push('<span style="font-size:15px">' + AIRPORTS[i][1] + '</span><br>' + AIRPORTS[i][3]);
  aDataSize.push(size);

  gmap.shapes.push({
    id: 'airport' + i,
    type: 'circle',
    size: size,
    backgroundColor: color,
    y: AIRPORTS[i][4] + 'lat',
    x: AIRPORTS[i][5] + 'lon',
    map: 'fraL2',
    hoverState: {
      backgroundColor: 'none',
      borderColor: color,
      borderWidth: 2,
      size: size + 4,
    },
    tooltip: {
      text: '<span style="font-size:15px">' + AIRPORTS[i][1] + '</span><br>' + AIRPORTS[i][3]
    }
  });
}


// LINE CHART CONFIG
// -----------------------------
let gline = {
  type: 'line',
  height: '100%',
  width: '100%',
  x: 0,
  y: 0,
  title: {
    text: 'Airports sorted by altitude',
    align: 'left',
    fontSize: 11,
    padding: '15 10 10 45',
  },
  plotarea: {
    margin: '10 20 25 40'
  },
  tooltip: {
    visible: false
  },
  scaleX: {
    zooming: true,
    visible: false,
  },
  scaleY: {
    format: '%vm',
    item: {
      fontSize: 10
    },
    minValue: 0,
    maxValue: iMaxAltitude,
    offsetStart: 10,
    short: true,
  },
  crosshairX: {
    plotLabel: {
      text: '%data-info<br>%node-value m',
      align: 'left',
      borderRadius: 3,
      borderWidth: 1,
      fontSize: 13,
      fontWeight: 'bold',
      padding: '10 20',
      shadow: true,
      shadowAlpha: 0.7,
      shadowColor: '#333',
      shadowDistance: 2,
    }
  },
  scrollX: {},
  series: [
    {
      values: aValues,
      lineColor: '#467686',
      lineWidth: 1,
      maxNodes: 99999,
      dataInfo: aDataInfo,
      dataSize: aDataSize,
      marker: {
        type: 'circle',
        backgroundColor: '#467686',
        borderWidth: 0,
        size: 2,
        rules: [
          {
            rule: '%data-size === 5',
            size: 5,
            backgroundColor: '#022733'
          },
          {
            rule: '%data-size === 8',
            size: 8,
            backgroundColor: '#26596A'
          }
        ]
      }
    }
  ]
};


// ADD CHART INTERACTION
// -----------------------------

// Mouseout
zingchart.bind(line, 'guide_mouseout', function (p) {
  zingchart.exec(map, 'removeobject', {
    type: 'shape',
    dynamic: true,
    id: 'marker'
  });
});

// Mousemove
zingchart.bind(line, 'guide_mousemove', function (p) {
  let idx = p.items[0].nodeindex;
  let size = 2;
  if (AIRPORTS[idx][2] === 'medium_airport') {
    size = 5;
  }
  if (AIRPORTS[idx][2] === 'large_airport') {
    size = 8;
  }
  zingchart.exec(map, 'addobject', {
    type: 'shape',
    dynamic: true,
    data: {
      flat: true,
      id: 'marker',
      type: 'circle',
      backgroundColor: 'none',
      borderColor: '#900',
      borderWidth: 2,
      size: size + 4,
      y: AIRPORTS[idx][4] + 'lat',
      x: AIRPORTS[idx][5] + 'lon',
      map: 'fraL2'
    }
  });
});


// RENDER CHARTS
// -----------------------------
zingchart.DEV.RESOURCES = false;

// Render charts after the maps module has loaded
// See `zingchart.loadModules()` above
function render() {
  zingchart.render({
    id: map,
    width: '100%',
    height: '100%',
    output: 'svg',
    data: gmap
  });
  zingchart.render({
    id: line,
    width: '100%',
    height: '100%',
    output: 'svg',
    data: gline
  });
}