ZingChart Themes
The ZingChart library has several built-in themes as well as the ability to extend and create new themes.
Implementation
Graphset
You can enable themes in several ways. The first way to enable a theme is a the graphset level.
let chartConfig = {
  theme: 'dark',
  graphset: [{
    type: 'line',
    noData: {},
    series: []
  }]
};
Top Level
If you are not using graphset, you can just define theme in the top level of your chart configuration.
let chartConfig = {
  theme: 'dark',
  type: 'line',
  noData: {},
  series: []
};
Globally
You can define a theme globally at the window level by defining the theme on the zingchart window object.
// MUST define before zingchart.render() call
zingchart.THEME = 'dark';
let chartConfig = {
  type: 'line',
  noData: {},
  series: []
};
Defaults (Custom)
You can define a theme globally in a JavaScript variable and assign the theme defaults at render.
// MUST define at a scope available at zingchart.render()
let myTheme = {};
let chartConfig = {
  type: 'line',
  noData: {},
  series: []
};

zingchart.render({
  id: 'myChart',
  data: chartConfig,
  defaults: myTheme
});
Defaultsurl (Custom)
You can define a theme globally in a .txt file and assign the theme defaults at render.
// MUST define at a scope available at zingchart.render()
let themeConfig = {};
let chartConfig = {
  type: 'line',
  noData: {},
  series: []
};

zingchart.render({
  id: 'myChart',
  data: chartConfig,
  defaultsurl: './path/to/myTheme.txt'
});
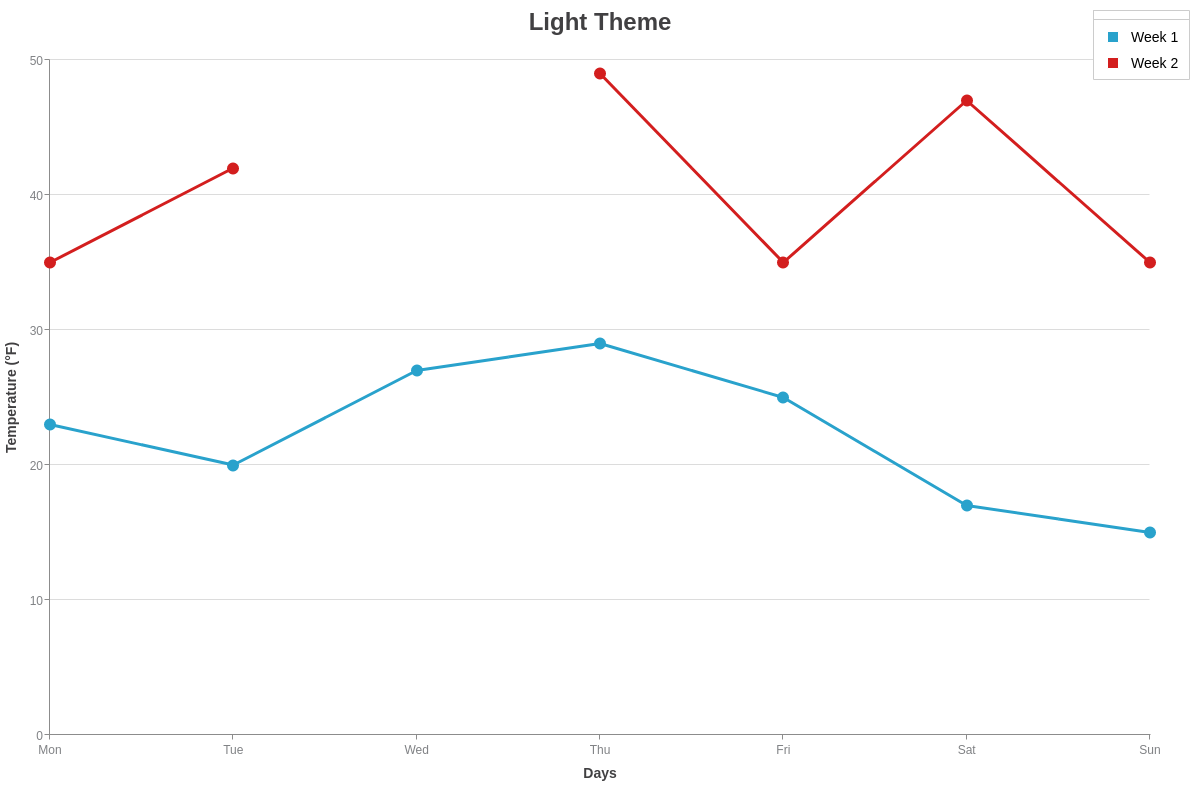
Default (Light)
The light theme is enabled by default implicitly.
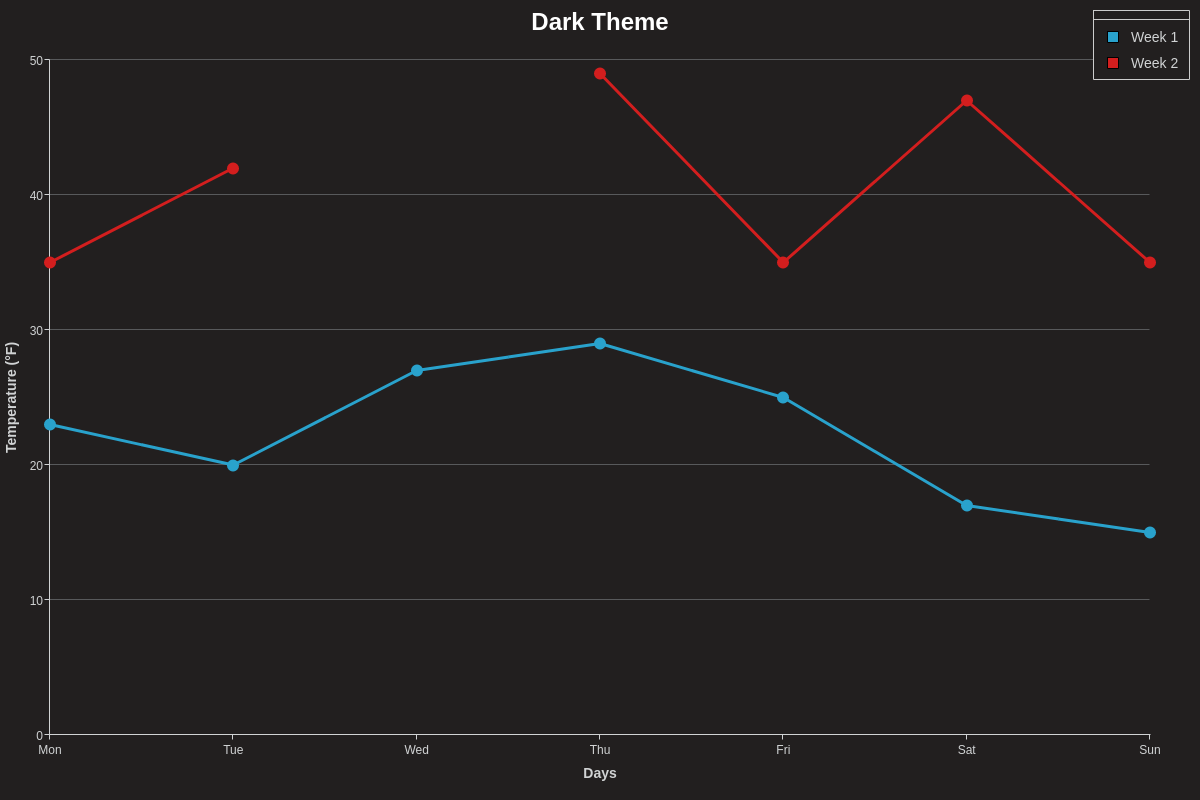
Dark
The dark theme will make the chart dark and the text light.
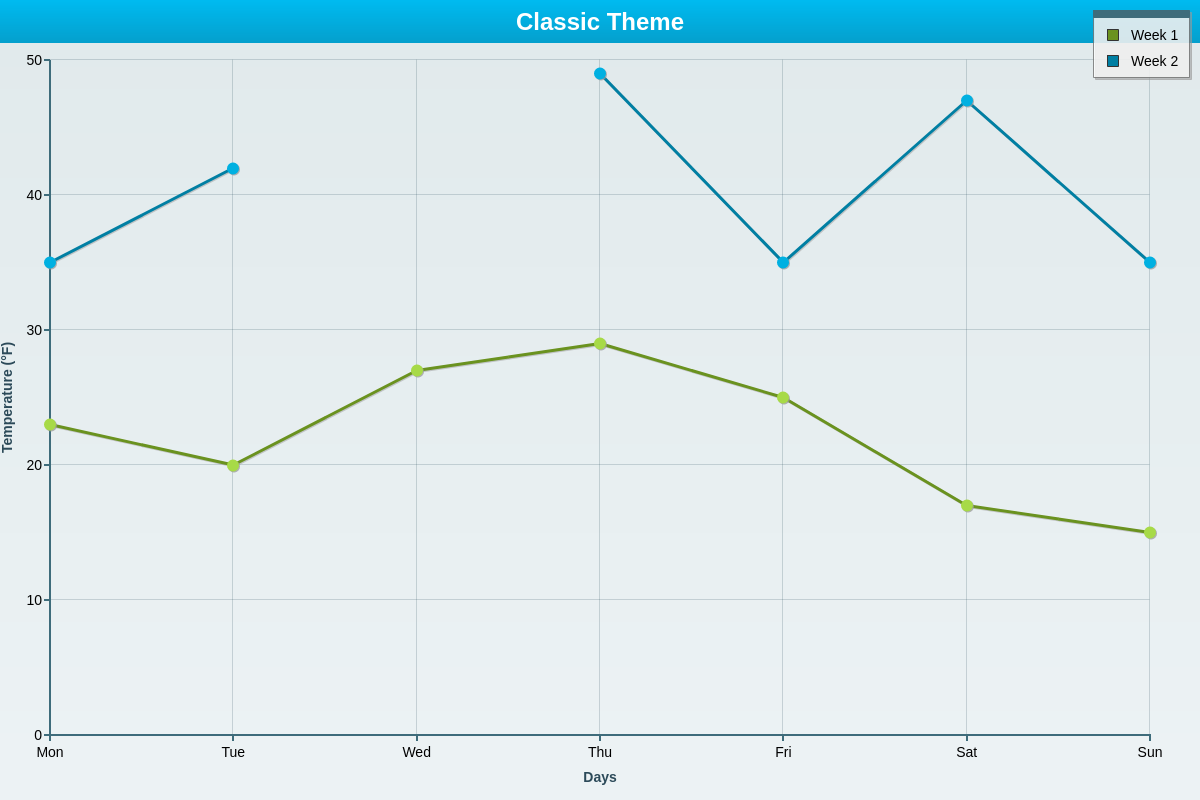
Classic
The classic theme was the original theme from our Flash days. For backwards compatibility and to pay homage our roots, we still keep it around.
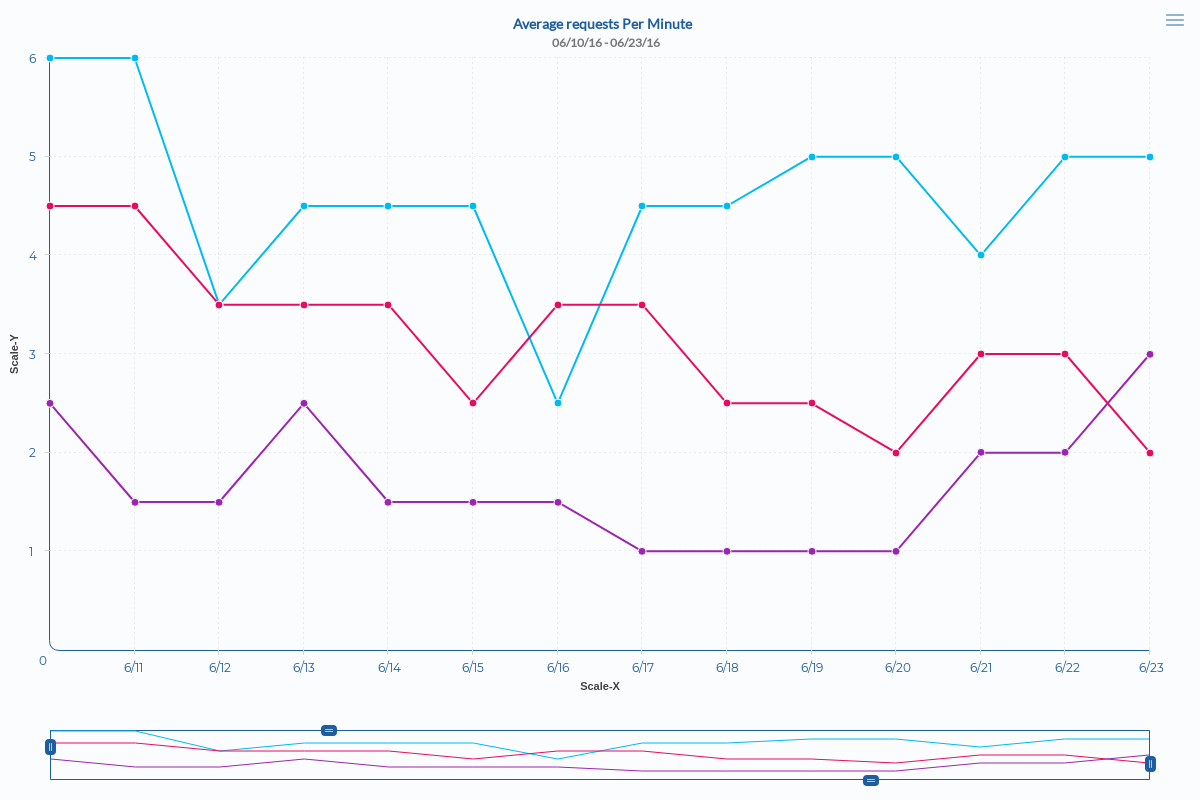
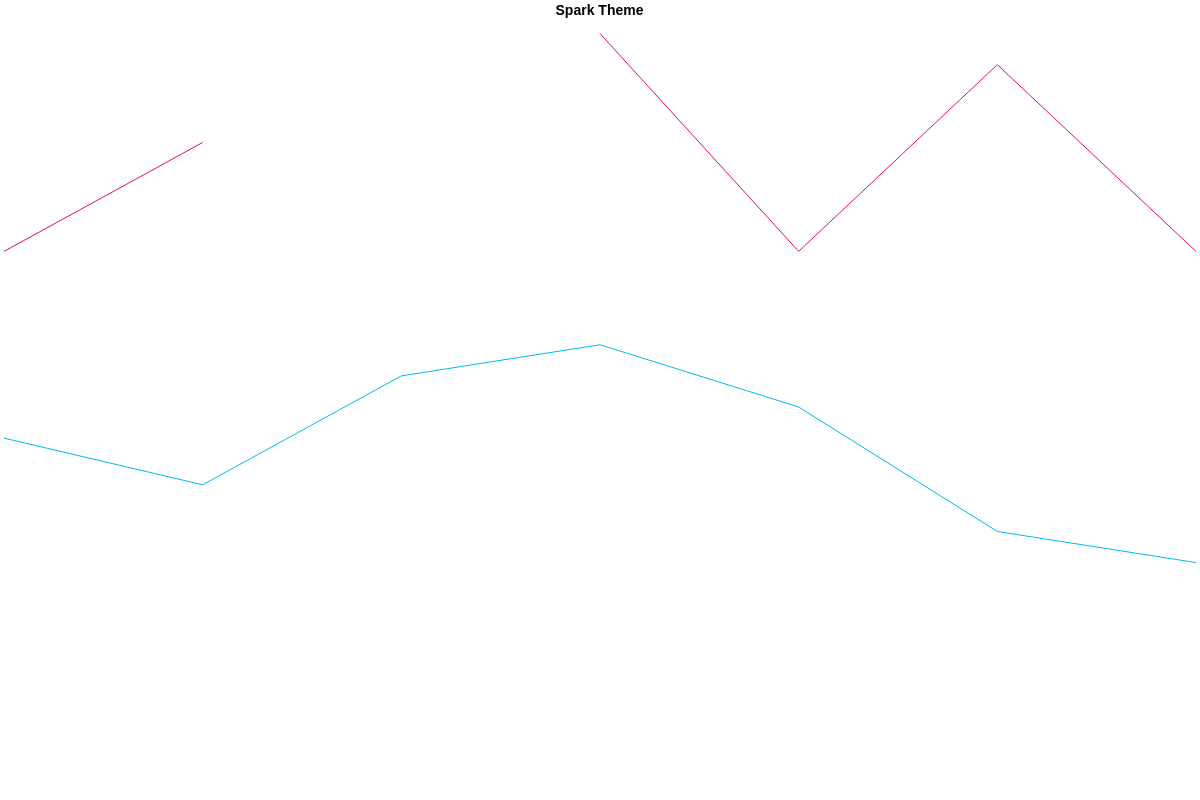
Spark
The spark theme will remove all text and axis lines from the chart. The spark theme is a shortcut of default attributes which turn off a lot of features.
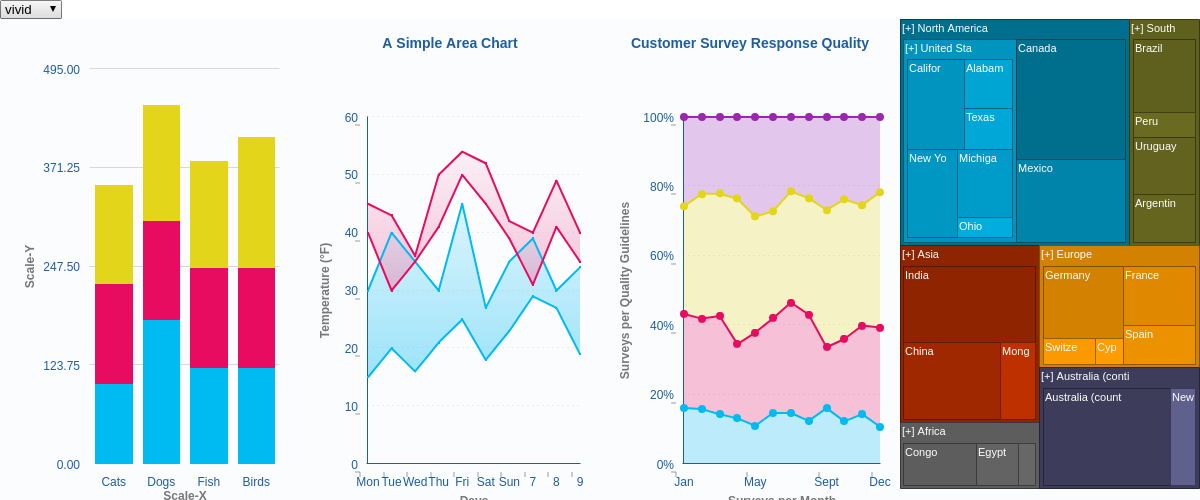
Custom
A custom theme can be defined globally and applied to your charts.
Summary
Themes allow you to quickly apply preset styling to each of your charts. You can use our built in themes or create your own!