Passing Data as JavaScript Objects
Overview
ZingChart is incredibly flexible and accepts many forms of JavaScript objects to create and update your charts.
Full JavaScript Objects
Begin by creating a JavaScript object.
<script>
  var dataObj = {};
</script>
Populate your JS object with your chart configuration.
<script>
var dataObj={
    type: "line",
    title: {
        text: "Chart Data Object"
    },
    series: [
        {
            values: [69,68,54,48,70,74,98,70,72,68,49,69]
        }
    ]
};
</script>
Standard JavaScript objects and JSON can both be used. Here is the above JS object in flat JSON form:
var dataObj={
    type: "line",
    title: {
        text: "Chart Data Object"
    },
    series: [
        { values: [69,68,54,48,70,74,98,70,72,68,49,69]
        }
    ]
};
Pass the object into your zingchart.render()function call's data option.
<script>
var dataObj={
    type: "line",
    title: {
        text: "Chart Data Object"
    },
    series: [
        {
            values: [69,68,54,48,70,74,98,70,72,68,49,69]
        }
    ]
};

window.onload=function(){
    zingchart.render({
        id: "myChart",
        output: "svg",
        height:400,
        width: "100%",
        data:dataObj
    });
};
</script>
Demo
Individual Objects
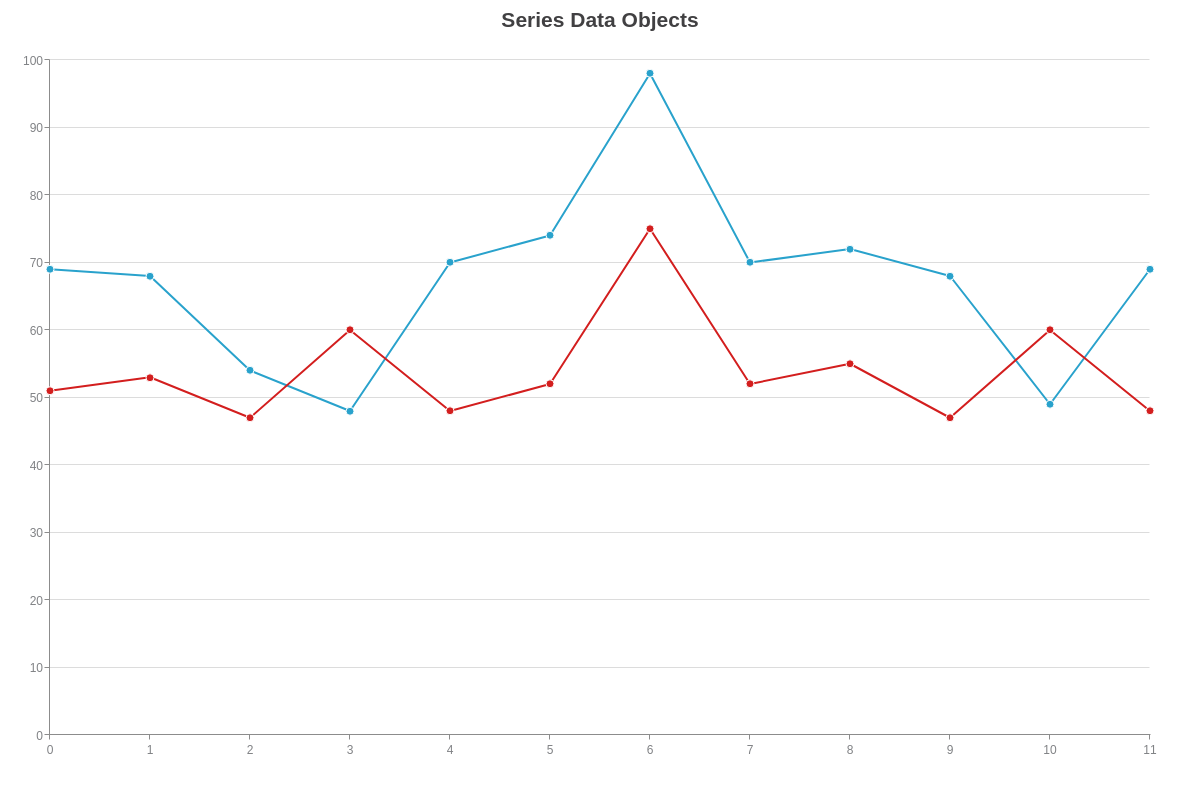
You can create JavaScript objects to hold individual chart objects for use in your chart JSON.
<script>
var seriesObj1={
    values: [69,68,54,48,70,74,98,70,72,68,49,69]
};
var seriesObj2={
    values: [51,53,47,60,48,52,75,52,55,47,60,48]
};

window.onload=function(){
    zingchart.render({
        id: "myChart2",
        output: "svg",
        height:400,
        width: "100%",
        data: {
            type: "line",
            title: {
                text: "Series Data Objects"
            },
            series: [
                seriesObj1,seriesObj2
            ]
        }
    });
};
</script>
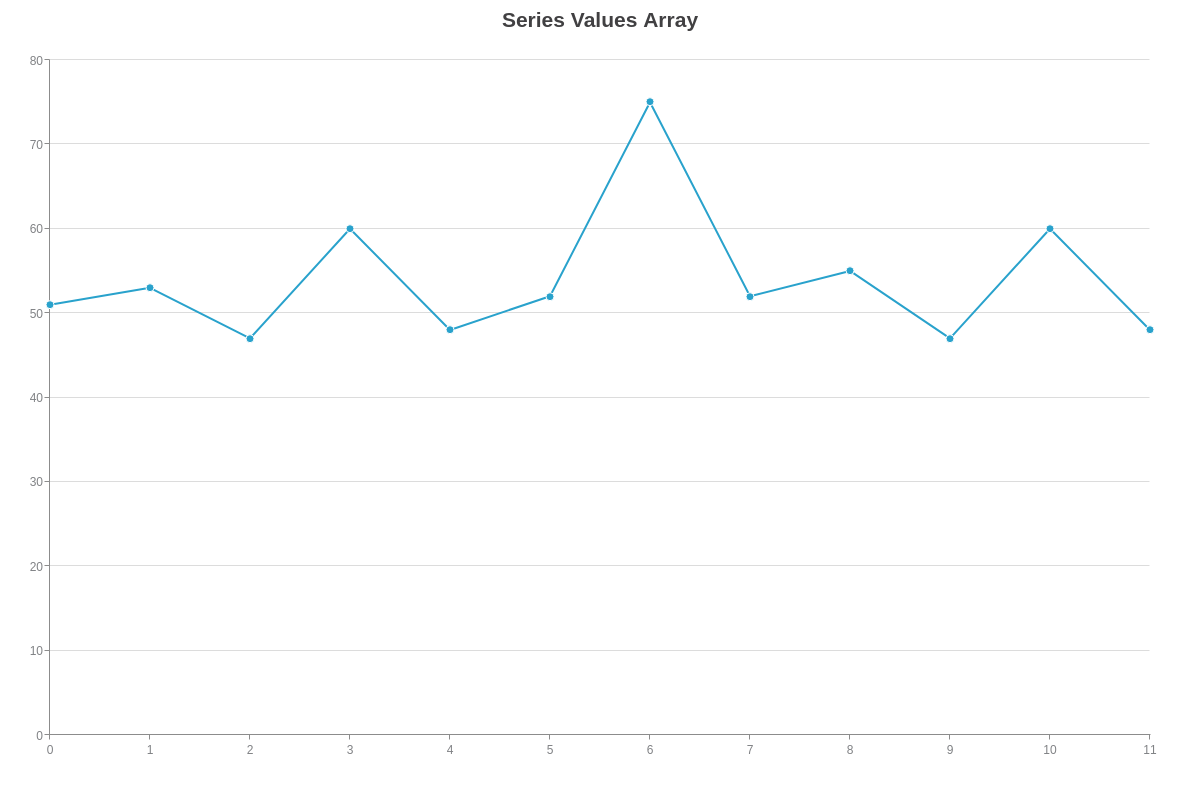
JavaScript arrays can also be used in chart data.
<script>
var valueArray=[51,53,47,60,48,52,75,52,55,47,60,48];

window.onload=function(){
    zingchart.render({
        id: "myChart3",
        output: "svg",
        height:400,
        width: "100%",
        data: {
            type: "line",
            title: {
                text: "Series Values Array"
            },
            series: [
                {
                    values:valueArray
                }
            ]
        }
    });
};
</script>
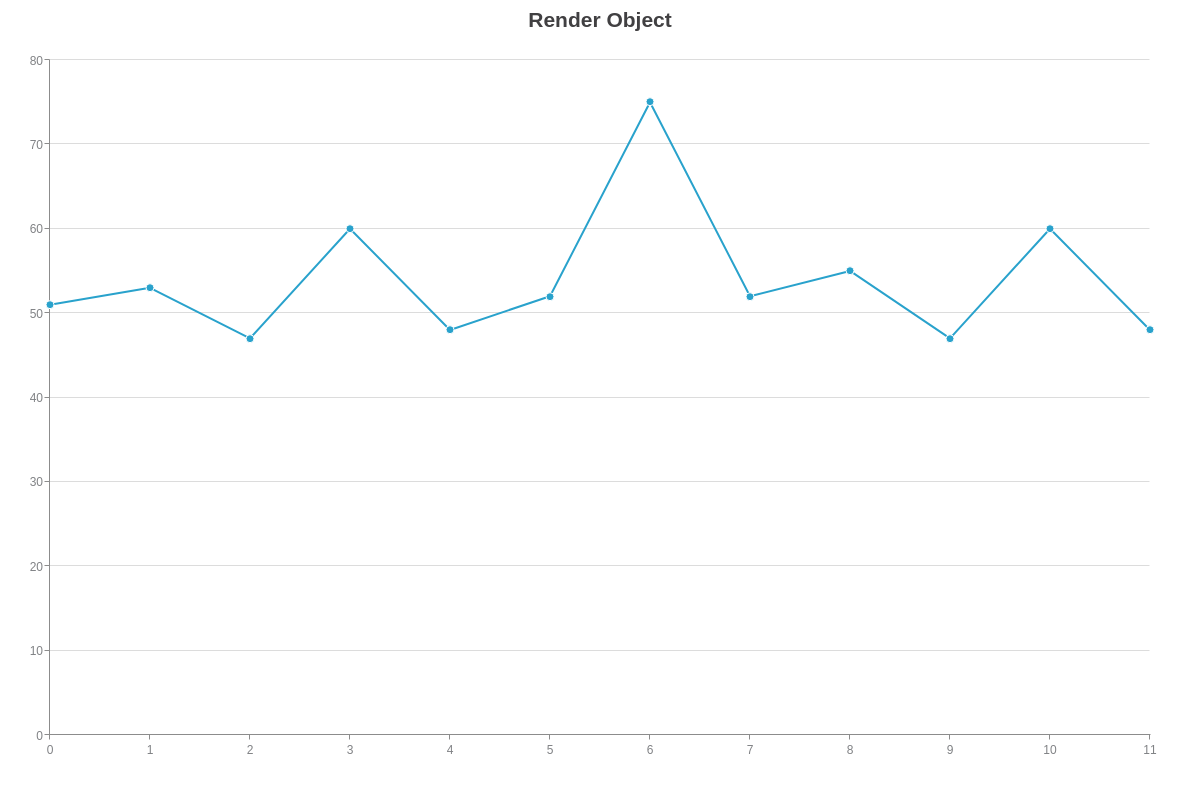
Config Objects
Use a JavaScript object to hold zingchart.render() options.
<script>
var renderObj={
    id: "myChart4",
    output: "svg",
    height:400,
    width: "100%",
    data: {
        type: "line",
        title: {
            text: "Render Object"
        },
        series: [
        {
            values: [51,53,47,60,48,52,75,52,55,47,60,48]
        }
        ]
    }
};

window.onload=function(){
    zingchart.render(renderObj);
};
</script>
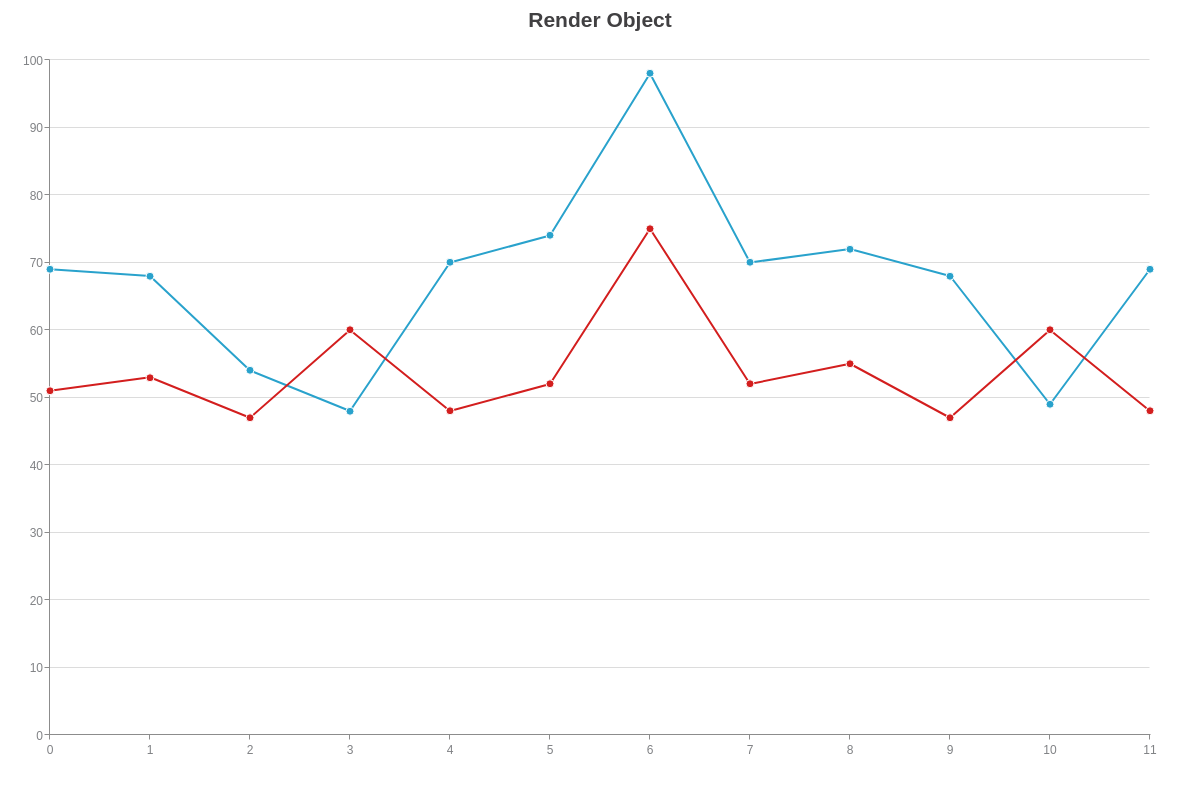
Modify object properties using dot-notation or bracket notation.
<script>
var renderObj={
    id: "myChart4",
    output: "svg",
    height:400,
    width: "100%",
    data: {
        type: "line",
        title: {
            text: "Render Object"
        },
        series: [
        {
            values: [51,53,47,60,48,52,75,52,55,47,60,48]
        }
        ]
    }
};

window.onload=function(){
    zingchart.render(renderObj);

    renderObj.id="myChart5";
    renderObj[ "data" ]={
        type: "line",
        title: {
            text: "Changing Properties w/ Dot-Notation and Bracket Notation"
        },
        series: [
        {
            values: [51,53,47,60,48,52,75,52,55,47,60,48]
        }
        ]
    };

    zingchart.render(renderObj);
};
</script>
Summary
JavaScript objects allow for a ton of flexibility and can make it simple to manipulate chart data using JavaScript or our extensive API.