Titles
Chart Titles
Overview
ZingChart allows you to use chart titles and subtitles to personalize your data visualizations. The "source" object also allows you to quickly add a data source to your chart.
Title
A title adds a header in a prominent location on your chart. Many of the standard ZingChart attributes can be used to style and position the title's text and background.
Basics
The first step to adding a title is to add the "title" object.
title: { }
At the minimum, you will need to add the "text" attribute to your "title" object.
title: {
  text: "My Title"
}
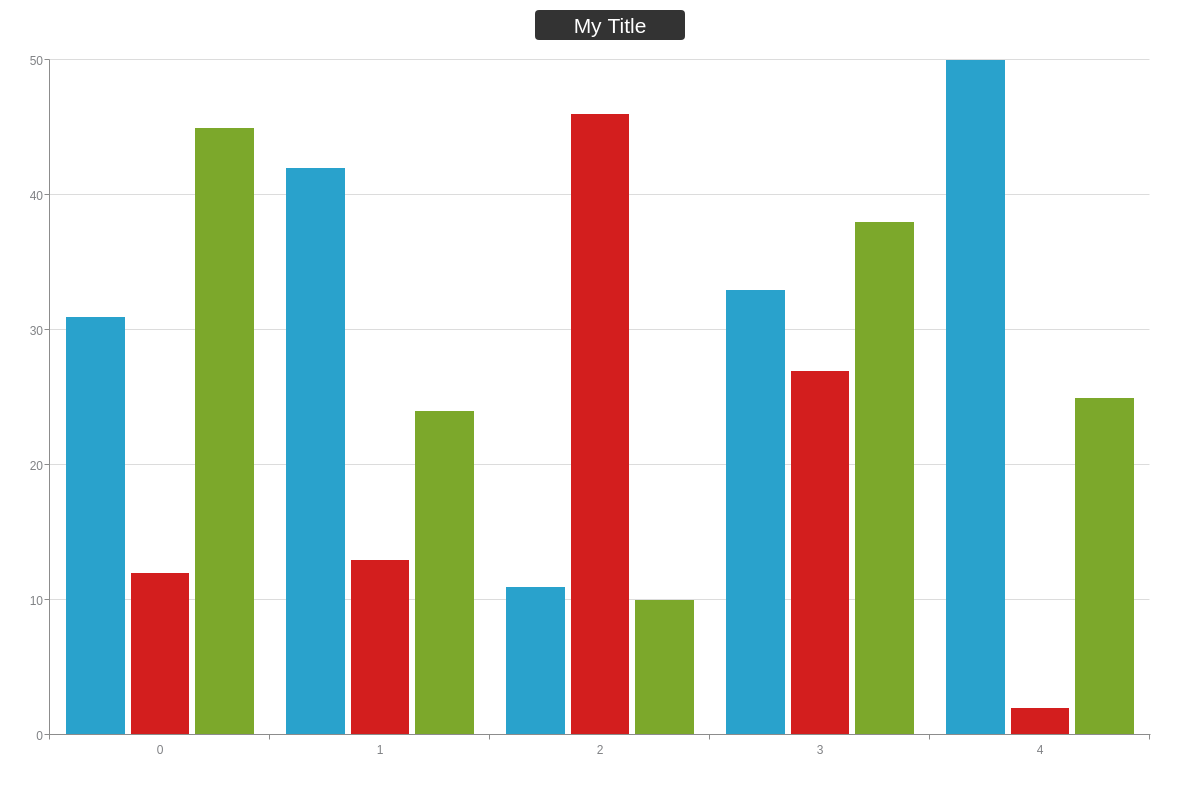
Title Styling and Positioning
Many of the standard styling and positioning attributes can be applied to modify the title object. For example, we can use "padding", "offset-x", "offset-y", height, and width attributes to move and resize the title. We can also change various font attributes, as well as the appearance of the title object.
title: {
  text: "My Title",
  width: 150,
  height: 30,
  'offset-x': 10,
  'offset-y': 10,
  'background-color': "#333",
  color: "#FFF",
  'border-radius': "4px",
  'font-weight': "none"
}
To see all title attributes, visit our JSON Syntax page.
Subtitle
A subtitle is used to provide additional information to supplement your chart's title. This feature lets you add information in a prominent location under the title.
Basics
The first step to adding a subtitle is to add the "subtitle" object.
subtitle: { }
At the minimum, you will need to add the "text" attribute to your "subtitle" object.
subtitle: {
  text: "My Subtitle"
}

Subtitle Styling and Positioning
Just as with the title object, many of the same styling and positioning attributes can be used with a subtitle.
subtitle: {
  text: "My Subtitle",
  color: "#7CA82B",
  'font-style': "italic",
  'font-size': 14
}

To see all subtitle attributes, visit our JSON Syntax page.
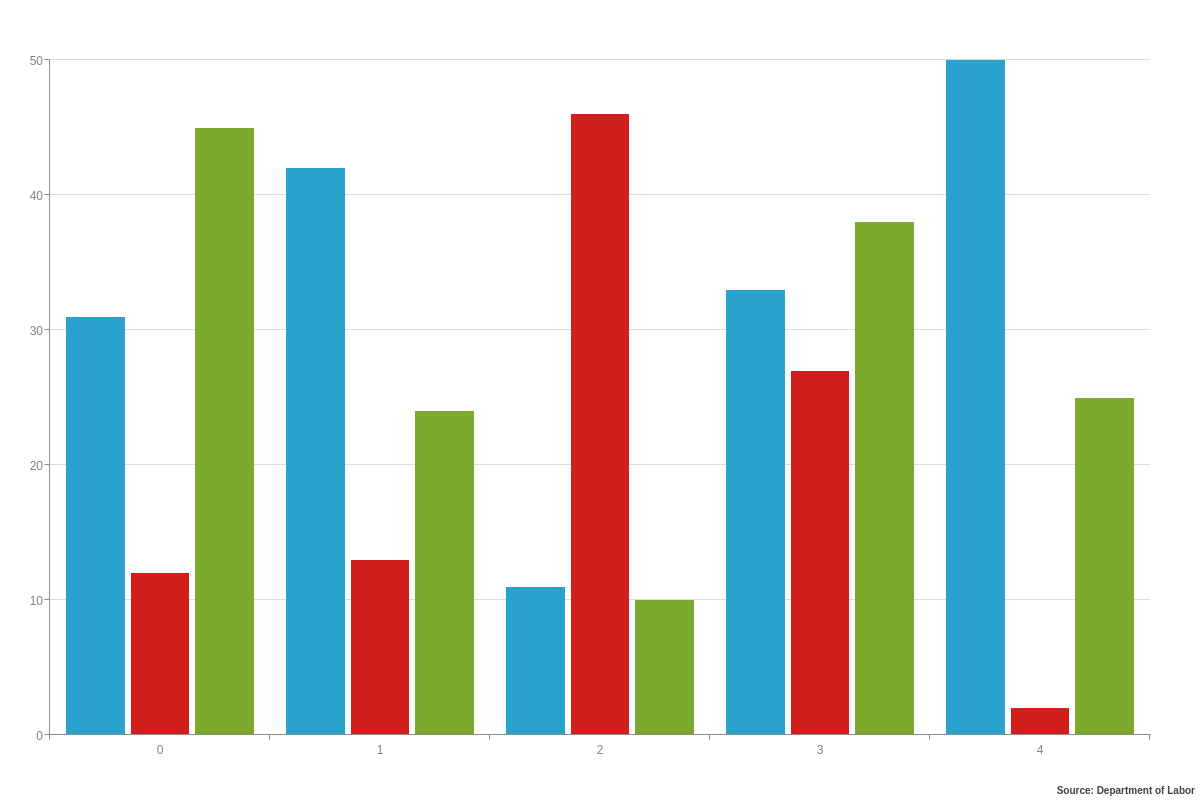
Source
The source feature places a text label on a chart to indicate a data source. By default, the source will appear in the bottom right corner of a chart. It can be useful when showing charts that contain data from an external source.
Basics
The first step to adding a source is to add the "source" object.
source: { }
At the minimum, you will need to add the "text" attribute to your "source" object.
source: {
  text: "Source: Department of Labor
}
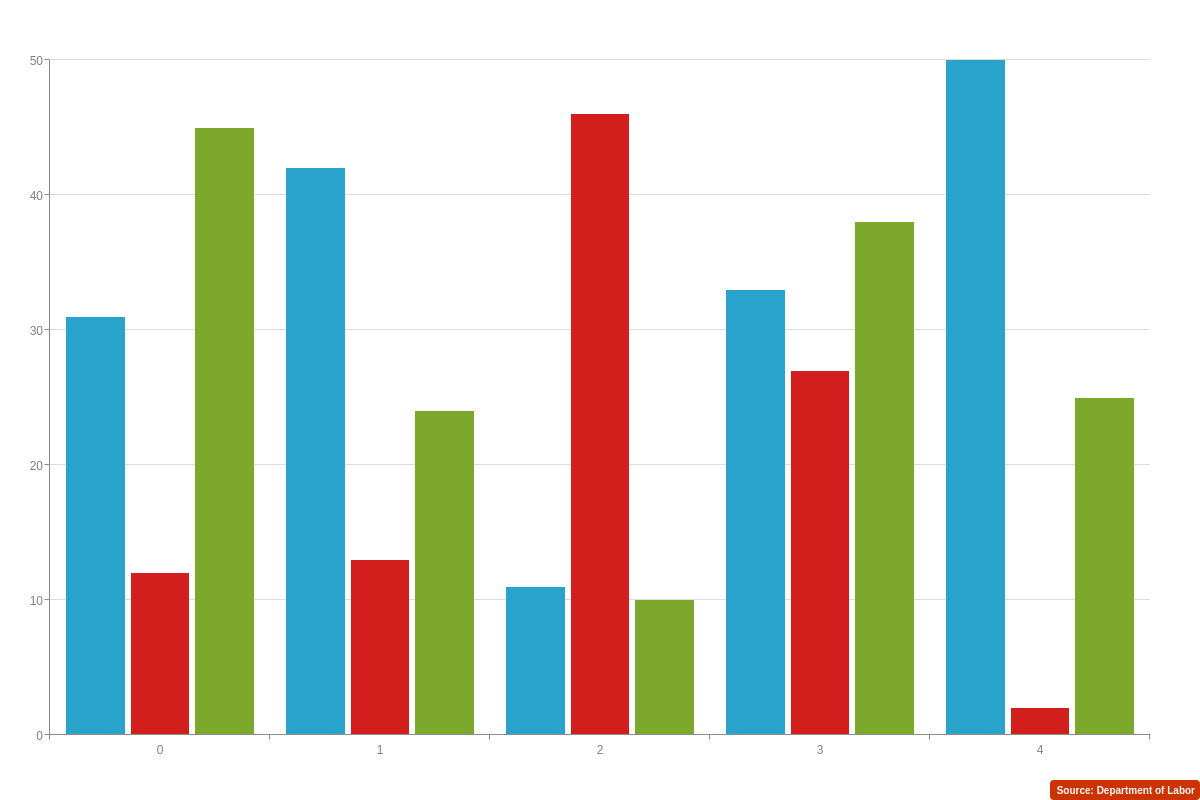
Source Styling and Positioning
Many of the same attributes are available to style and position the source object.
source: {
  text: "Source: Department of Labor",
  'background-color': "#C30",
  color: "#FFF",
  width:150,
  'border-radius':4
}
To see all source attributes, visit our JSON Syntax page.
Summary
Titles, subtitles, and sources are very important aspects of a good chart. Titles and subtitles allow the user to quickly understand the purpose of a chart, while a source backs up your data. Don't forget, a comprehensive list of available attributes and objects can be found on our JSON configuration pages for title, subtitle, and source.